Remap Power Figures: Why Dyno and Brochure bhp Differ
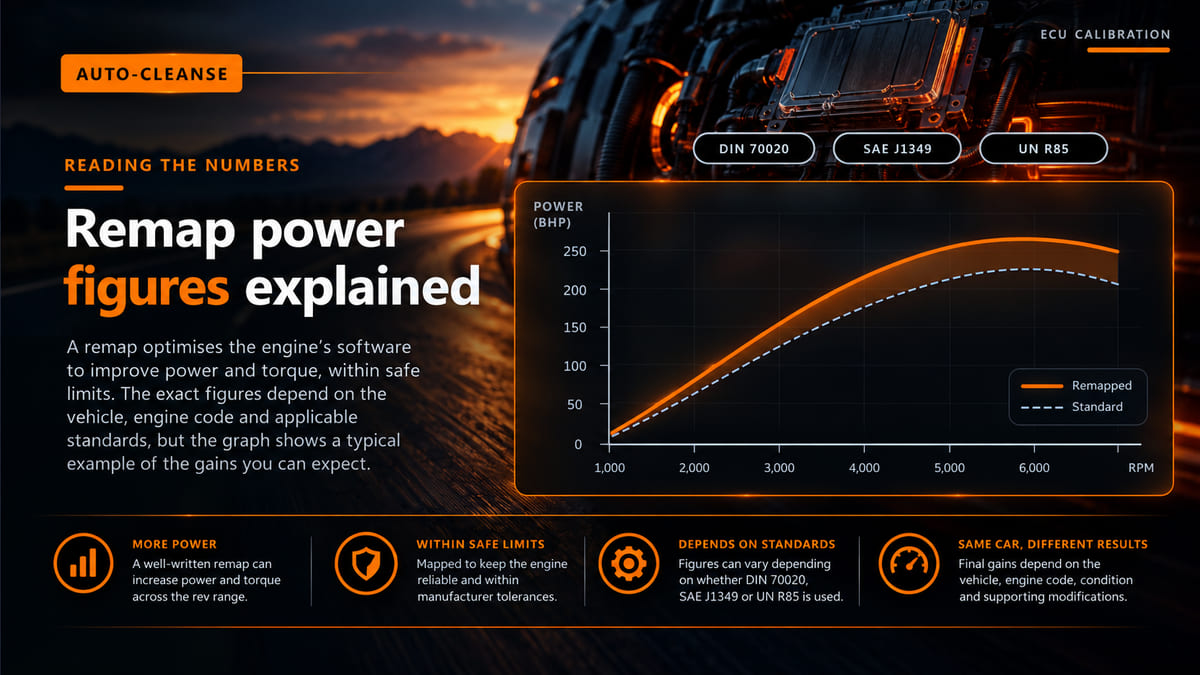
Remap power figures and quoted bhp gains vary because they are measured in different ways and under different conditions, and because production engines vary slightly. A manufacturer's figure comes from an engine test bench under a defined standard. A rolling-road figure is measured at the wheels and converted. A "typical gain" in a lookup tool is a representative figure for that engine, not a promise for one car.
For the typical Stage 1 gain on your engine, use our vehicle performance lookup. None of these numbers is wrong, but they are not directly comparable, so check how each one was measured before putting two side by side.
If you want a measured number, the only fair comparison is the same vehicle, on the same dyno, on the same day, with the same correction standard.
How much power does a remap add?
Gains from ECU remapping depend on the engine, its ECU software and its condition, which is why a responsible answer is a typical figure rather than a guarantee. A turbocharged engine has boost the calibration can raise, so it usually responds far more to a remap than a naturally aspirated one - our post on diesel versus petrol remapping explains why.
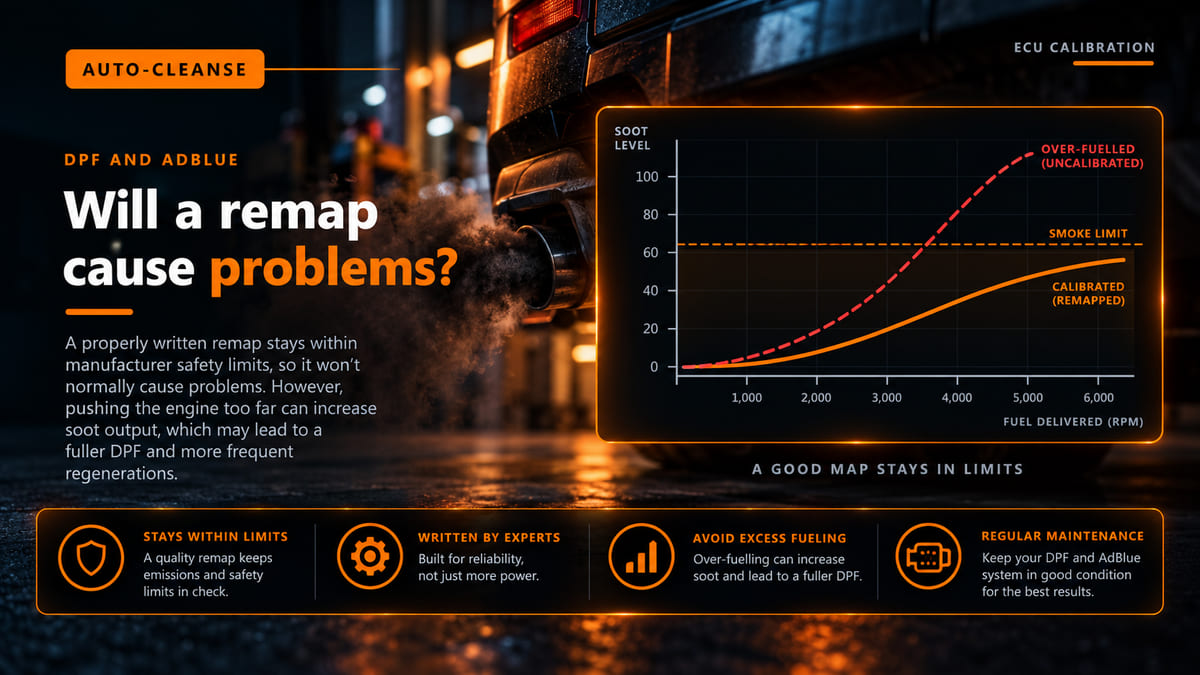
A healthy engine is the starting point. A car with a boost leak, a worn injector or a loaded DPF is likely to fall short of the typical figure, before and after the remap - why vehicle condition matters before a remap covers what to check first.
Where does the manufacturer's figure come from?
The power a manufacturer declares is measured on an engine test bench to a defined procedure. UN ECE Regulation 85 is the type-approval standard for this. It defines net power as the power at the end of the crankshaft on a test bench, corrected to reference conditions of 25°C and 99 kPa dry air pressure.
Two details in that regulation matter to owners:
- The declared figure has a tolerance. A manufacturer's declared maximum power is accepted if the measured figure is within 2 per cent of it.
- Production engines vary. In conformity-of-production checks, an engine's net power may differ by up to 5 per cent from the approval figure.
So two cars wearing the same badge can leave the factory with slightly different outputs, and both are within the rules. A remap starts from the engine you actually have, not the brochure.
PS, kW and bhp are not the same unit
Many manufacturers quote power in PS (metric horsepower) or kW, while UK owners tend to talk in bhp. Using NIST conversion factors, one PS is about 1.4 per cent smaller than one imperial horsepower, and one kW is about 1.34 horsepower. An engine rated at 150PS is therefore roughly 148bhp or 110kW. Check the units before comparing two figures.
How does a rolling road measure power?
A rolling road - a chassis dynamometer - measures the power arriving at the driven wheels. Wheel power is always lower than the engine's output, because some is lost between the crankshaft and the rollers: gearbox, final drive, tyres and the dyno itself. A "flywheel" figure is the wheel figure plus an estimate of those losses, so ask which one your printout shows.
Dyno manufacturer MAHA describes the engine power its rolling road reports as the wheel power plus a drag power, measured as the vehicle coasts down with the clutch disengaged. Other dynos and settings arrive at the losses differently. Either way, the flywheel number is derived rather than measured directly, which is one reason two rolling roads can disagree about the same car.
Correction standards: DIN, EEC and SAE
Engines make more power in cool, dense air than on a hot day. To make runs comparable, dyno software corrects the measured figure to a set of reference conditions - and there is more than one set. MAHA's operating instructions list five, including these three:
- DIN 70020 - a German standard that corrects to 20°C and 1013 mbar, ignoring humidity.
- EEC 80/1269 - the former EU engine-power directive. MAHA's formula for it uses the same 25°C and 99 kPa dry-air reference as R85.
- SAE J1349 - the SAE net power standard, which also corrects to 25°C and 99 kPa dry air pressure. The formulas are not identical for every engine type, but the main split is between DIN 70020 and the other two.
A 2003 paper in the Journal of the Brazilian Society of Mechanical Sciences and Engineering notes that the many correction factors in use often give different results for the same atmospheric conditions. Because DIN 70020 corrects to cooler, denser air than the 25°C standards, the same run will generally produce a higher DIN figure. Ask which standard was used before comparing two printouts.
Hub dynos and roller dynos
A hub dyno bolts directly to the wheel hubs with the wheels removed. With no tyre on a roller, there is no tyre slip and no tyre rolling resistance, which takes some variables out of the result. A roller dyno tests the vehicle on its own wheels and tyres. The two measure from different points in the driveline, so do not compare a hub-dyno figure with a roller figure.
What changes the number on the day?
Even on one dyno, the result moves with the conditions:
- Ambient and intake temperature. MAHA notes that modern engine management reduces power when intake temperatures are too high, which is why cooling airflow matters so much on a dyno.
- Heat soak. Back-to-back runs heat the intake and intercooler, so a later run can read lower than the first.
- Fuel quality. On a petrol engine, knock control retards ignition when it detects knock, which costs power on fuel below the grade the calibration expects.
- Tyre pressures. They affect rolling and flexing losses on the rollers, and dyno procedures call for them to be checked before a run.
- Strapping. How tightly the vehicle is tied down can change the tyres' rolling resistance on the rollers.
- Correction standard and loss method. The same run can give a different printout depending on both.
Common misreading: "The rolling road said my car was down on power, so it must be faulty." It may be. It may also be a hot day, a heat-soaked intercooler, a different correction standard or a different loss calculation. Rule out the test conditions, then check fault codes and live data, before condemning the engine.
How to compare remap power figures fairly
- Same dyno, same day, and the same operator if possible.
- Same correction standard and loss method on both runs.
- Same type of figure and units - wheel or flywheel, PS or bhp - on both sheets.
- Similar temperatures - let the vehicle cool between runs.
- Same fuel, tyre pressures and strapping.
- Compare the whole curves, not only the peaks.
- Repeat the runs. One run is a snapshot; several show what is consistent.
Peak power is only one point on a curve. Torque is usually the figure you feel in everyday driving, and peak power versus usable torque explains why the shape of the curve matters more than the headline number.
How Auto-Cleanse can help
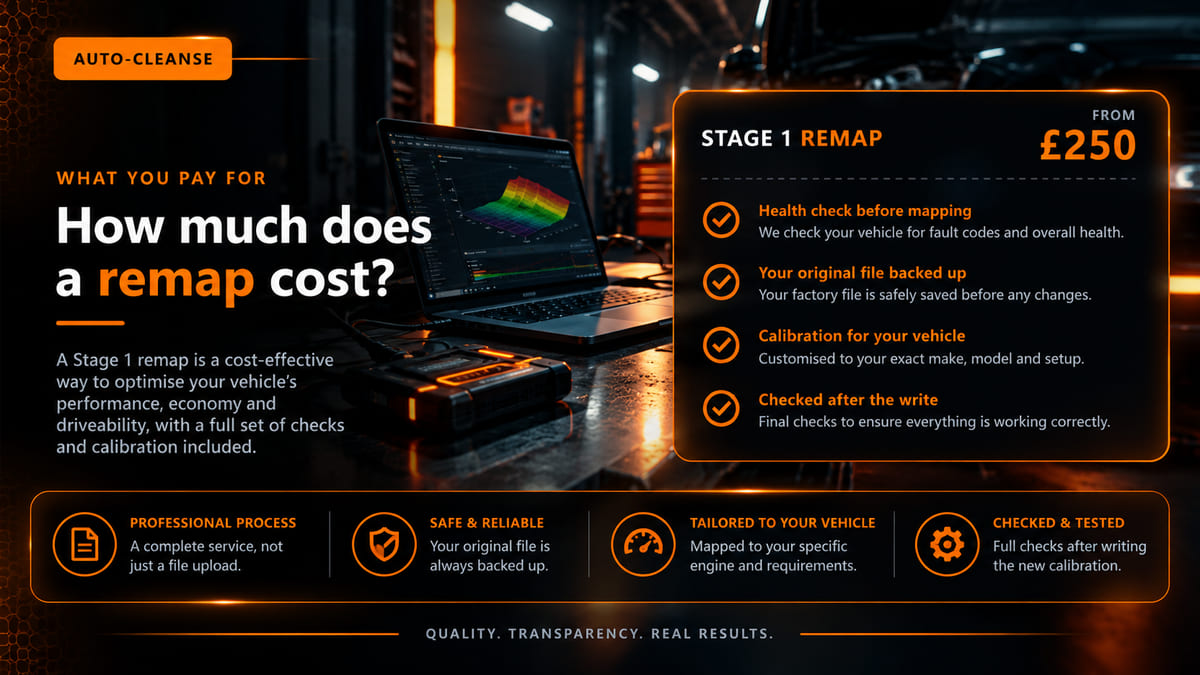
Every Stage 1 remap we carry out starts with a diagnostic health check, included in the Stage 1 price, and we only proceed if the engine is healthy - if there is a DPF, EGR or AdBlue fault, we quote to repair it first. The file is matched to the exact vehicle, a diagnostic check is run before and after, and the original is backed up so the car can be returned to stock. Stage 1 is £250 at our Totnes workshop or £270 as a mobile service. You can book a remap online with a £50 deposit, or call 07823 649190.
Frequently asked questions
How much bhp does a Stage 1 remap add?
It depends on the engine, its ECU software and its condition, and turbocharged engines usually gain far more than naturally aspirated ones. A lookup tool gives the typical figure for that engine; the result on an individual vehicle depends on its health and hardware.
Why do rolling road figures differ from the manufacturer's?
The manufacturer's figure is measured at the crankshaft on an engine test bench to a type-approval standard. A rolling road measures at the wheels, estimates the losses and applies a correction standard, and each step can move the number.
Does a remap need a rolling road?
No. A rolling road measures the result; it does not write the calibration. The safeguards are a health check before the remap and diagnostic checks afterwards, and both can be done at a workshop or on a driveway.
Should I get a dyno run before a remap?
Only if you want to measure the change. Without a before run on the same dyno, the after figure can only be compared with a brochure figure measured at the crankshaft on an engine test bench, which is not a like-for-like comparison.
The takeaway
Manufacturer figures, rolling-road figures and lookup estimates are measured differently, so they rarely match. Judge a remap on a like-for-like test and on how the torque is delivered, not on a single headline number.
Sources
- UNECE - Regulation No. 85, measurement of net power for vehicle type approval
- MAHA - LPS 3000 dynamometer operating instructions
- Journal of the Brazilian Society of Mechanical Sciences and Engineering - comparison of engine power correction factors
- Nicholson McLaren - hub dynamometer testing
- NIST - SI guide conversion factors for horsepower
- HELLA - knock sensor technical information
General technical guidance only. Manufacturer-specific handbook information, workshop procedures and specifications always take precedence.
Need help with this on your vehicle?
Auto-Cleanse can sort it. See our Vehicle Performance Lookup service, or get in touch.
Related: ECU Remapping · Stage 1 Remaps in Devon